How to Choose the Right Influencer for Your Campaign
Learn the exact engagement rate benchmarks for Instagram and TikTok across all creator tiers, and discover how to evaluate creators strategically before committing budget.
2 min read

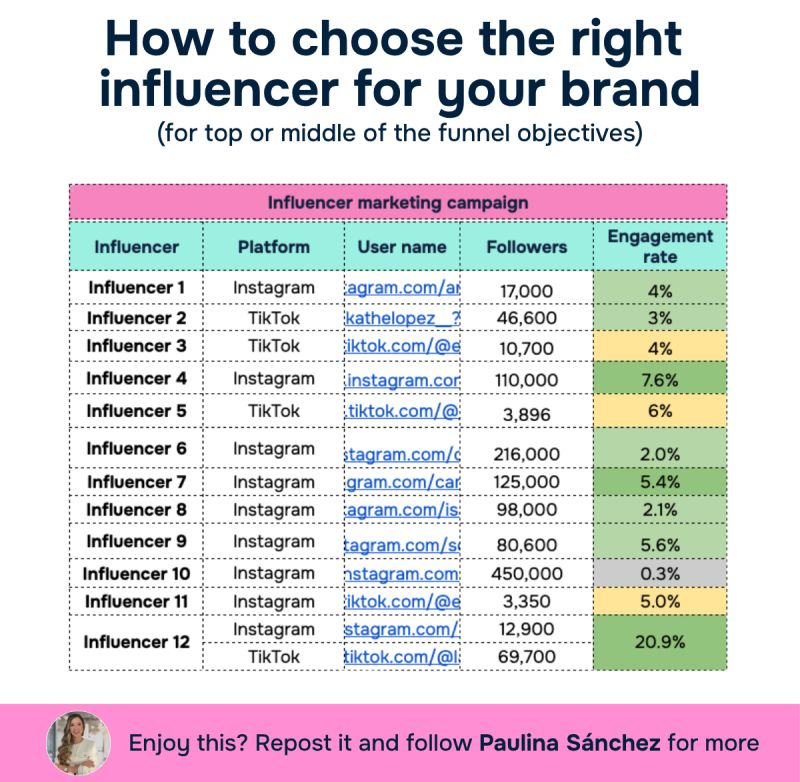
It is as simple as knowing the benchmarks and making decisions based on them.
Here are the exact engagement rate benchmarks we use at RealUp (updated for Q2 2026):
Instagram: ‣ Nano (1K–10K): 5–10%+ ‣ Micro (10K–100K): 3–6% ‣ Mid-tier (100K–500K): 2–4% ‣ Macro (500K–1M): 1.5–3% ‣ Mega (1M+): 0.5–1.5%
TikTok: ‣ Nano (1K–10K): 8–12%+ ‣ Micro (10K–100K): 6–10% ‣ Mid-tier (100K–500K): 4–7% ‣ Macro (500K–1M): 3–6% ‣ Mega (1M+): 1–3%
One rule: don't compare across tiers.
Engagement drops naturally as follower count rises, so a nano at 8% and a macro at 2.5% are both performing exactly where they should. What matters is whether they hit their own tier's benchmark, not someone else's.
Now, one thing to keep in mind: ER is a top-to-mid funnel metric.
It tells you if an audience is engaged, not if they're buying.
But an engaged audience that matches your ICP is how you build the pipeline before a conversion campaign.
That combination is where the real ROI starts. And it's also how you make the right strategic call upfront.
ER also tells you where in the funnel a creator will have the most impact.
High engagement signals a deeper audience connection: better for consideration and conversion campaigns.
Lower ER at scale signals broader reach: better for awareness.
Match the ER profile to the funnel stage your campaign is targeting before you commit the budget.
So here's how to actually run the numbers:
Pull the creator's last 10 posts. Calculate: (Likes + Comments + Saves) ÷ Followers × 100
Then compare to the benchmarks above: → Top of their tier range? Premium rates justified. → Middle? Standard. → Bottom? Negotiate. → Below range entirely? Walk away.
Save this before your next creator conversation
Enjoy this?
Follow me on LinkedIn